Why Homeowners Insurance Premiums Cost 10–15 Times More Than Renters Insurance: A 2026 Analysis. Average homeowners insurance costs $2,100–$2,600 annually, while renters insurance averages $151–$171 per year—a massive gap driven by structural coverage, liability exposure, and climate-driven inflation. This guide explains each factor, shows real-world cost comparisons, and shares actionable strategies to lower your premium.
Coverage Comparison: What You’re Actually Paying For
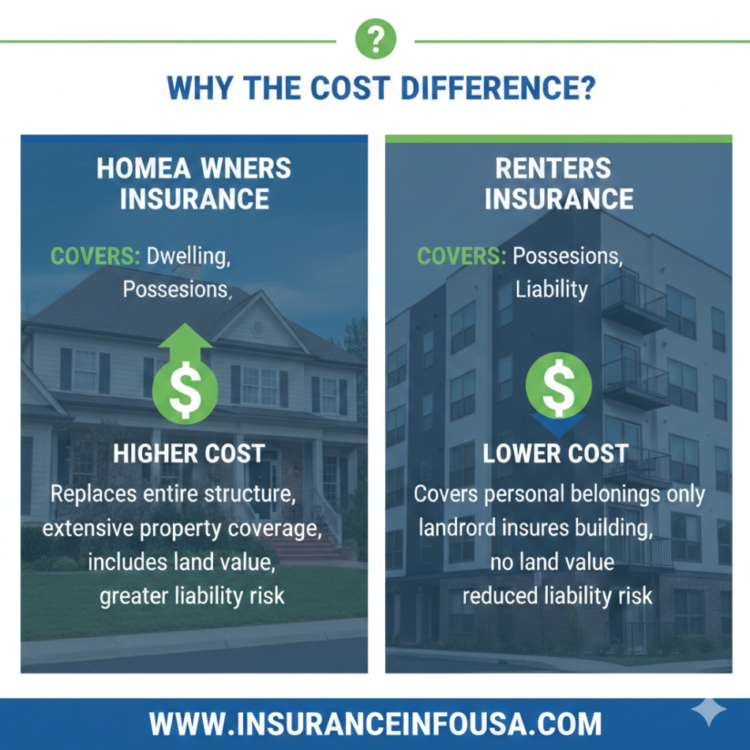
The core reason for the price difference is simple: homeowners insurance covers the building itself, while renters insurance does not. Here’s what separates them:
| Coverage Type | Homeowners Insurance | Renters Insurance |
|---|---|---|
| Dwelling/Structure | ✓ Covers the physical home (often $200K–$500K+) | ✗ Landlord’s responsibility |
| Personal Property | ✓ Included (up to 50–70% of dwelling limit) | ✓ Included (primary focus) |
| Liability | ✓ $100K–$300K+ standard | ✓ $100K–$300K standard |
| Additional Living Expenses (ALE) | ✓ Covers hotel, meals if home is uninhabitable | ✗ Limited or excluded |
| Flood Coverage | ✗ Separate NFIP policy required | ✗ Separate policy required |
| Annual Cost | $2,100–$2,600 (2026 average) | $151–$171 (2026 average) |
Six Core Reasons Homeowners Insurance Costs So Much More
1. You’re Insuring Your Largest Asset—The Building Itself
Homeowners policies protect the dwelling structure, which typically represents 60–80% of your total home value. If a covered loss destroys your house, the insurer must pay to rebuild it completely—often costing $200,000 to $1 million depending on square footage, location, and construction quality.
Renters, by contrast, insure only personal belongings—laptops, furniture, clothing, electronics. The landlord’s insurance covers the building. A typical renter’s personal property limit is $25,000–$50,000, far less than a homeowner’s dwelling coverage.
2. Replacement Cost Inflation Has Driven Premiums Up Sharply
Construction material and labor costs have surged dramatically since 2020, and this remains a major rate driver in 2026.
Key facts:
- Replacement costs for property and casualty losses increased 45% between 2020 and 2023, according to the U.S. Department of the Treasury’s Federal Insurance Office.
- Labor costs for residential construction jumped 37% between 2018 and 2022, further compounding the problem.
- Lumber, concrete, steel, and roofing materials remain elevated due to ongoing supply-chain constraints and skilled trade shortages.
Because insurers must rebuild homes at current market prices, not 2019 prices, homeowners premiums have risen to reflect this reality. Renters insurance avoids this exposure entirely—their claims involve clothing, electronics, and furniture, which depreciate rather than inflate with construction cycles.
3. Homeowners Face Far Higher Claim Severity and Catastrophe Risk
A typical homeowners claim averages $19,000–$24,000, according to U.S. Department of the Treasury analysis of 2018–2022 data. Major losses—roof replacement, structural repairs, foundation work—easily exceed $50,000 and can reach hundreds of thousands.
Climate-driven events are accelerating these costs:
- Homeowners in the 20% of ZIP codes with the highest climate-related risk paid $2,321 in premiums annually—82% more than those in low-risk zones.
- Average claim severity in high-risk areas reached $24,000 compared to $19,000 in low-risk areas.
- Wind damage can increase premiums by up to 58%, while wildfire risk can add 8% or more to your policy.
Renters claims are lower-severity: a stolen laptop ($1,500), water damage to belongings ($3,000), visitor injuries ($10,000–$50,000). Claim frequency and severity remain far below homeowners losses.
4. Liability Exposure and Additional Living Expenses (ALE) Are Larger
Homeowners carry broader liability exposure: if a guest is injured on your property, if your tree falls on a neighbor’s home, or if a visitor’s personal property is damaged, you may be liable. Standard homeowners policies include $100,000–$300,000 in liability coverage; liability incidents can result in catastrophic payouts.
Additionally, Additional Living Expenses (ALE) coverage pays for hotel, meals, and rent if your home is uninhabitable after a covered loss—potentially thousands per month for extended rebuilds. Renters policies typically include limited or no ALE.
5. Property-Level Underwriting Complexity Increases Costs
Insurers price each homeowners policy based on granular property factors:
- Roof age and material (asphalt shingles vs. metal vs. tile)
- Foundation type (concrete slab, crawlspace, basement)
- Distance to fire hydrants and fire station
- Proximity to coast (wind/hurricane risk)
- Nearby vegetation and tree coverage (wildfire/storm damage risk)
- Building codes and year constructed
- Electrical, plumbing, and HVAC system updates
Each property receives a unique risk score, and properties with older roofs, wood-shake construction, or wildfire exposure face significantly higher premiums—sometimes 25–50% above average.
Renters pricing is simpler: location, coverage limits, deductible, and claims history are the primary factors. Individual unit-level property conditions matter less.
6. Reinsurance Costs and Market Capacity Constraints
Insurers purchase reinsurance—insurance for themselves—to manage catastrophe risk. After major loss years, reinsurance becomes more expensive and harder to secure. These costs are passed directly to consumer premiums.
According to the U.S. Government Accountability Office (GAO), state insurance regulators take 305–331 days on average to approve premium increases in California and Colorado. Where regulatory delays are longest, insurers often retreat from high-risk areas entirely, reducing competition and raising local prices.
Some homeowners in Florida, Louisiana, Texas, and California—states with high climate and market volatility—have seen nonrenewal rates 80% higher than in lower-risk zones, forcing them to the state insurer of last resort with even higher premiums.
2026 Cost Benchmarks: National Averages
Based on the most recent data from the U.S. Department of the Treasury, Government Accountability Office, and NerdWallet:
| Metric | 2026 Benchmark | Source |
|---|---|---|
| Average homeowners insurance | $2,100–$2,600/year | Treasury/GAO/CFA data |
| Average renters insurance | $151–$171/year | NerdWallet, Insurance Information Institute |
| Cost ratio | Homeowners = 12–17× renters | Direct calculation |
| Highest-cost states (homeowners) | Florida, Louisiana, Oklahoma | Treasury/GAO analysis |
| Lowest-cost states (homeowners) | Wyoming, Wisconsin, Minnesota | GAO data |
| Premium growth (2019–2024) | +3% (inflation-adjusted) nationally; +25% in coastal areas | GAO report (Feb 2026) |
Why Flood Insurance Is a Separate, Critical Expense?
Standard homeowners and renters policies exclude flood damage entirely. The National Flood Insurance Program (NFIP), administered by the Federal Emergency Management Agency (FEMA), is the primary source for flood coverage.
Key facts about flood insurance:
- Average NFIP flood insurance costs $934 annually nationwide (ranges $429–$1,678 by state).
- Maximum NFIP building coverage: $250,000; contents: $100,000.
- Coverage takes 30 days to activate (with limited exceptions).
- Just 1 inch of standing water causes ~$25,000 in damage, per FEMA.
- Only 4% of U.S. renters carry flood insurance, creating a severe coverage gap.
Mortgagees in FEMA-designated high-risk (A or V) zones require flood insurance as a loan condition. Even renters in first-floor or basement units should consider separate flood coverage, as landlord policies do not protect tenant belongings.
Step-by-Step Buyer’s Guide: Compare Quotes and Lower Costs
Calculate True Replacement Cost (Not Market Value)
Use a rebuild cost estimator (most insurers provide free tools) to determine the actual square-foot cost to reconstruct your home with current materials and labor. In 2026, typical residential rebuild costs range $150–$250+ per square foot depending on region and quality.
Example: A 2,000-square-foot home in a high-cost area costs $200/sq. ft. to rebuild = $400,000 Coverage A dwelling limit needed.
Compare Apples to Apples
When collecting quotes, verify identical coverage elements:
- Dwelling limit (Coverage A)
- Personal property limit (Coverage C)
- Liability limit (typically $100K–$300K)
- Deductible (common: $500–$2,500)
- Valuation method: Replacement cost vs. actual cash value
- Endorsements (water backup, earthquake, jewelry scheduling)
A $300,000 policy with a $500 deductible is not comparable to a $250,000 policy with a $1,500 deductible.
Increase Your Deductible Strategically
Moving from a $1,000 to $2,500 deductible can reduce premiums 10–25%, depending on your insurer and risk profile. Only increase if you can comfortably cover the higher out-of-pocket cost without financial strain.
Bundle Home and Auto Insurance
Multi-policy bundling typically saves 10–25% on combined premiums. Shop with carriers that offer compelling bundle rates.
Invest in Mitigation and Document Improvements
Insurers reward risk reduction:
- Roof replacement (especially to Class A fire-resistant materials): 10–15% discount
- Security systems (burglar alarm, monitored fire detection): 5–10% discount
- Hurricane shutters or storm doors in coastal areas: 5–15% discount
- Fire-resistant landscaping and tree removal: 5–10% discount
- Updated electrical, plumbing, and HVAC systems: 5–10% discount
- Water leak sensors and smart home devices: 5% discount
Obtain written confirmation from your insurer before investing, and keep receipts.
Shop Annually at Renewal
Competitive quotes from at least three carriers often reveal 20–40% price variation for identical coverage. Don’t renew automatically—use captive agents, independent brokers, direct carriers, and insurtech platforms.
Consider Supplemental Policies
Certain risks are excluded or sublimited in standard policies:
- Flood insurance (separate NFIP or private policy)
- Earthquake insurance (especially in CA, OR, WA, AK)
- Sewer backup (often an endorsement)
- Valuable items scheduling (jewelry, art, antiques—avoids sublimits)
- Water damage from roof leaks (some carriers limit this)
2026 Insurance Industry Trends Affecting Your Rates
AI and Drone-Based Underwriting
Insurers increasingly use satellite imagery, drones, and machine learning for faster risk assessment. This can lower premiums for low-risk properties but may increase costs if vulnerabilities (old roof, brush near the home) are detected. Regulatory bodies require transparency in many states.
ZIP-Code-Level Climate Risk Pricing
Post-2023 risk modeling now prices premiums to hyper-local flood, wildfire, wind, and storm exposure. Homes in the same ZIP code can have dramatically different rates based on elevation, proximity to water, and vegetation density.
Reinsurance Market Volatility
Higher catastrophe losses worldwide have tightened reinsurance capacity and raised prices. These costs flow directly to consumer premiums, especially in high-risk coastal and wildfire-prone regions.
Product Innovation: Resilience Incentives
Insurers offer emerging products and discounts for FORTIFIED standards (wind-hardened homes), parametric insurance (automatic payouts based on hurricane intensity), and usage-based policies for specific risks.
State-Specific Considerations
High-Cost States for Homeowners (2026)
Florida, Louisiana, Texas, Oklahoma, and California have the highest average premiums due to:
- Catastrophe exposure (hurricanes, wildfires, severe storms)
- Market constraints and insurer exits
- Regulatory delays in premium approval
- Elevated claims severity
Example: Florida homeowners paid an average of $2,321 annually in high-risk ZIP codes as of 2022–2024 data, compared to the national average.
Flood Insurance Lapse and Renewal (2026 Update)
The National Flood Insurance Program’s authority temporarily expired in 2025. While Congress has reauthorized it through January 2026, existing policies remain valid, but new and renewal policies were paused during the lapse. As of May 2026, NFIP is reauthorized; verify your renewal status if your policy was affected.
Frequently Asked Questions
Q: Is homeowners insurance mandatory?
A: Yes, if you have a mortgage. Lenders require it to protect their interest in the property. If you own the home outright, it’s optional—but financially risky.
Q: What’s the difference between actual cash value and replacement cost?
A: Actual Cash Value (ACV) subtracts depreciation (age, wear). A 10-year-old roof pays out less under ACV. Replacement Cost reimburses the full cost to rebuild/repair with new materials. Replacement cost is more expensive but far more valuable after a loss.
Q: Will my homeowners insurance cover earthquake or flood damage?
A: No. Both are automatically excluded from standard homeowners policies. You must purchase separate earthquake and flood insurance. Earthquake coverage is optional; flood coverage is required by lenders if your home is in a designated FEMA flood zone.
Q: If I rent, do I need renters insurance?
A: Yes, strongly recommended. Your landlord’s building insurance does not cover your personal belongings or liability. Renters insurance is affordable ($151–$171/year) and protects your assets and covers legal liability if someone is injured in your rental unit.
Q: Can I reduce my homeowners insurance by paying annually instead of monthly?
A: Most insurers offer a 2–8% discount for annual or semi-annual payment, avoiding monthly installment fees.
Q: What is a deductible, and how does it affect my rate?
A: A deductible is the amount you pay out-of-pocket before insurance pays. Higher deductibles = lower premiums. Common deductibles are $500, $1,000, or $2,500. Choose only what you can afford in an emergency.
Q: Why did my homeowners insurance premium jump $200–$500 in one year?
A: Primary causes include replacement cost inflation, reinsurance rate increases, local catastrophe losses, roof age, claims history, or a move to a higher-risk ZIP code. Request a renewal reason statement from your insurer and shop competitors.
Q: Is homeowners insurance tax-deductible?
A: Not for primary residences. Self-employed individuals may deduct business property insurance. Consult a tax professional for your specific situation.
Q: Do I need an “umbrella” or “excess liability” policy?
A: If your home’s liability limit is $100,000–$300,000 and your assets exceed that, an umbrella policy (typically $1M coverage for $150–$300/year) provides additional liability protection and is often recommended.
Action Checklist: Lower Your Homeowners Premium Today
- Obtain a replacement cost estimate for your home using your insurer’s tool or a local appraiser.
- Request three quotes with identical dwelling limits, deductibles, and coverage types.
- Verify your roof age and condition—if over 20 years, consider replacement and ask about discounts.
- Install and register security systems and fire alarms—claim proof to your insurer for discounts.
- Bundle home and auto with the same carrier and compare savings.
- Increase your deductible to a level you can afford and recalculate savings.
- Document recent updates (HVAC, electrical, plumbing) and provide proof to insurers.
- Check if you’re eligible for flood insurance via FEMA Flood Map Service Center; purchase if in a high-risk zone.
- Review your policy annually at renewal and shop competitors.
- Consider earthquake and sewer backup endorsements if not included, especially in high-risk regions.
Conclusion
Homeowners insurance costs 10–17 times more than renters insurance because homeowners protect a massive asset (the dwelling), face higher liability exposure, and shoulder the cost of reconstruction during periods of material and labor inflation. Renters, by contrast, insure only personal belongings—a fraction of the financial exposure.
Key takeaways:
- Average homeowners insurance: $2,100–$2,600/year
- Average renters insurance: $151–$171/year
- Replacement cost inflation, catastrophe risk, and reinsurance costs are the
Sources & References
This article is based on the most current and authoritative sources available as of May 2026:
Federal Government Agencies:
- U.S. Department of the Treasury, Federal Insurance Office (FIO). “National Insurance Report: State of the Insurance Industry.” https://home.treasury.gov/fio
- Federal Emergency Management Agency (FEMA). “National Flood Insurance Program (NFIP) Statistics and Analysis.” https://www.fema.gov/flood-insurance/nfip-statistics
- U.S. Government Accountability Office (GAO). “Homeowners Insurance: Current Market Conditions and Regulatory Challenges.” February 2026. https://www.gao.gov
- U.S. Census Bureau. “American Housing Survey.” https://www.census.gov/programs-surveys/ahs.html
- FEMA Flood Map Service Center. “Flood Hazard Mapping.” https://msc.fema.gov/portal/home
- U.S. Bureau of Labor Statistics. “Producer Price Index (PPI).” https://www.bls.gov/ppi/
Industry & Research Organizations:
- Insurance Information Institute (III). “2026 Homeowners and Renters Insurance Report.” https://www.iii.org
- National Association of Insurance Commissioners (NAIC). “State Insurance Regulator Database.” https://www.naic.org
- NerdWallet. “2026 Homeowners and Renters Insurance Cost Analysis.” https://www.nerdwallet.com/article/insurance/homeowners-insurance
- American Property Casualty Insurance Association (APCIA). “Homeowners Insurance Market Report.” https://www.apcia.org
Disclaimer: Insurance rates, coverage limits, and regulations change frequently. This article reflects 2026 data and should not replace consultation with a licensed insurance agent or broker for personalized advice.